Educators: Would you rather use an intervention program that sometimes helps students a great deal but requires an additional 90 minutes a week or one that helps students improve their learning to a lesser degree but takes no additional time? Find out how to read the research that programs use to make their claims so that you can make an informed decision!
Co-written by Nathaniel Hansford, teacher and author of The Scientific Principles of Teaching and Pedogogynongrata.com and Rachel Schechter, PhD, founder of LXD Research and former research leader at HMH and Lexia Learning.
Armed with your professional learning goals and the Five Steps to Finding Research Articles, you have an academic article of interest and are excited to dig in. Gah – roadblock! It’s 40 pages long and full of academic jargon and data. Don’t let that deter you, and don’t be afraid of the data. The article can be read in an efficient way if you know what to look for. Research articles are divided into sections (the Abstract, Introduction, Methods, Results, and Discussion), and not all of these sections are equally useful to you as a teacher.
With teachers’ needs in mind, let’s break down the steps to selectively reviewing a scientific article in an efficient way that minimizes time spent reading and maximizes understanding. (We are featuring images from thenounproject.com today, hope you like them!)
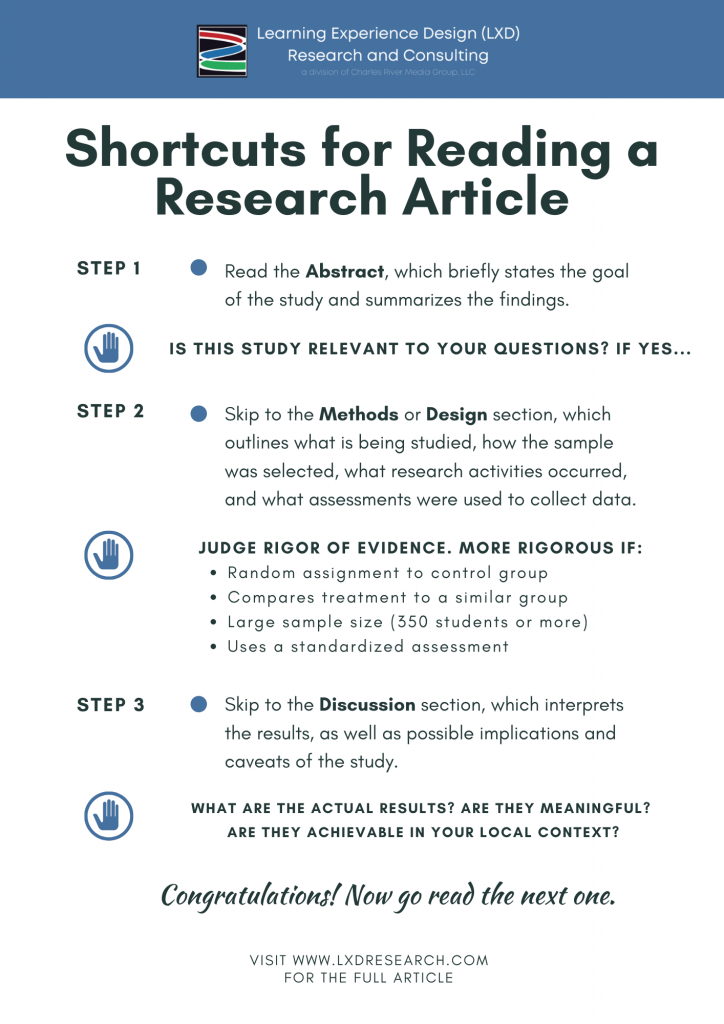

Step 1: Read the Abstract to figure out what specifically was studied. Titles can be vague or misleading: make sure the study is actually about what you think it is about. A study may have examined Blended Learning, but what aspects of Blended Learning did the authors study specifically?
Look for these details in the Abstract and Introduction sections. The Abstract briefly states the purpose or goal of the study and summarizes the findings. The Introduction includes a rationale for the study, describes past research findings on this topic, and defines relevant terms.

Step 2: Check the Methods section to evaluate study quality and relevance: Did the study include a control group? Is the sample size large enough to be meaningful? Were the groups randomly assigned (a Randomized Controlled Trial, or RCT, study)? Are the participant demographics relevant to your local context?
The Methods section (also referred to as Design) outlines what is being studied, how the sample was selected, what research activities occurred, and what assessments were used to collect data. This is where you can evaluate the rigor of the study using ESSA evidence levels (see this article for descriptions and more terminology) and how relevant the study is to your local context (e.g., demographics of students, amount of training needed). Things to check for in the Methods section include:
The sample size, often represented with the letter n in study graphics, refers to the number of participants or students included in the study. Generally speaking, studies with larger sample sizes (350 students per group) are more representative than ones with smaller sample sizes. (The Reading League published this really nice document with research definitions and some more context for reading research, link here to request it!)

Inclusion of control or comparison groups in experimental and quasi-experimental studies provide us with more confidence in the results because they help isolate the impact of the treatment (e.g., use of a particular intervention) on the results. In case studies, on the other hand, researchers might compare student performance on a pre-test to a post-test, making it hard to distinguish between growth that’s due to the intervention and growth that would have occurred anyway without the intervention. Or they might compare one cohort of students to another without controlling for differences between the groups that could impact the results. These approaches often lead to outsized results, which can further distort the story.
The use of randomization to assign participants to treatment or control groups reduces bias and increases the likelihood that the two groups start out very similar, increasing confidence that any differences between the groups after the study are due to the treatment. This practice is considered the gold standard for research, and the results of RCT studies should be taken more seriously than non-RCT studies.
The type of assessments used for data collection also factor into study quality and our confidence in the results. A standardized assessment has been researched to show it is consistent across students, while a non-standardized assessment is typically developed by the researcher to assess student learning for the study. Standardized assessments are typically used in rigorous research studies to determine student outcomes, while using non-standardized assessments is more acceptable in research that would be considered exploratory, or to help inform a teacher about possible impact.

Step 3: Skip the Results section for now (we will cover this section next time) and go straight to the Discussion section, which summarizes the results for you (thanks, authors!) and infers why they may be important. What do the results suggest? Are they meaningful?
The Discussion section covers the authors’ interpretations of the results, as well as their reflections on the possible implications, caveats of the study, and suggestions for future research. To help get the study published, authors may overemphasize the magnitude and importance of their own results. For example, authors will focus more on statistically significant results within the Discussion section and not spend much time on insignificant results (though this information is still reported in the Results section).
Fidelity of implementation, or how closely the experimental group followed the parameters of the experiment or the program’s guidelines, may be referenced in either the Results or Discussion sections. Fidelity can be gauged based on implementation logs, observations, or surveys from teachers and school leaders. Was the program delivered in 150 minutes a week (as suggested) or in 300 minutes a week (double what is typically prescribed)? Were the components used as intended? The answers can make a big difference in our interpretation of the results and how realistic it would be for us to achieve similar learning outcomes. Ultimately, fidelity is important to consider when evaluating something like a literacy program, as you want to know if the program actually works as designed and advertised.
Quick Hint: Consider using our research checklist to help with the process of reviewing for ESSA levels.
Once you understand what you are looking for, you can actually start to read studies more quickly, skimming for key pieces of information. To make this process even faster, you can click “Ctrl + F” to bring up the search function and find the sections/key words you’re looking for. You can search for the section headers and for summary-statement phrases like “results suggest” or “the data show.”
As a newly empowered reader of scientific articles, take the short cuts below along on your research read-through. Consider keeping notes. Consider sharing what you learn with colleagues. As you write, share and speak the research terms that you’re seeing in scientific articles – like all vocabulary, the research jargon will become more familiar as you encounter it and use it.
___
Be sure to look out for our next article in the series, in which we look at how to find the scientific consensus on a topic.